bama_ed
It's kind of fun to do the impossible-Walt Disney
- Joined
- Sep 23, 2004
- Messages
- 13,517
Our 10th Anniversary of Fort Wilderness Rack Rates and Analysis!

After sitting on the data for a couple weeks, I've decided to go ahead and publish the rate data for 2025 at the Fort as it is right now. The reason I waited was that Disney has not released rates yet for December 2025. So I could not give 12-month 2025 info. The alternative was to give 11-month numbers or (what I ultimately decided to do was) provide 12-months of rates STARTING WITH DECEMBER 2024 and ending with the data for November 2025 (hence the asterisk * in the thread title). When December 2025 data is announced, I'll probably update to a calendar 2025 file.
A couple changes were implemented this year. I decided to list the data for EVERY NIGHT in the 12 months for all categories (campsites and legacy cabins). It actually took less time to implement than one might think. The data source is from the disneworld.com resort quote tool for the dates in the files. I also included Legacy FW Cabins (the ones being currently removed) but did not have 2023 data so there is no cabin year-over-year analysis.
All that being said .....
To set up the numbers, these were the rates on the stated dates they were pulled. Disney has and does increase rates during the season (rarely decreases) so if anything rates you find might be HIGHER than these. These rates included the 12.5% tax added to the plain rack rate and are rounded to the nearest dollar (for my sanity). Thus the rates shown represent your out-of-pocket spend.
2025 rates for all levels of campsites increased approximately 3.4-4.0% over 2024 rates. Overall the increase was 3.5% which was slightly below 2023's 3.7% and the smallest increase since the 2016 rates.
The rates with the green header at the top of the page are the daily (nightly) rates for the date shown.
The rates with the orange header at the top of the page are the 30 night totals for arrivals on the date shown.
The reason I went with showing rates per night was to be able to total up the cost of the maximum 30 night stay currently allowed. We have some DIS guests who go for long stays and I thought this would be helpful to show how much that stay might run (especially if it included various rate seasons like the January lower rates with the February higher rates). I have included a snip of each table below showing some January 2025 data.
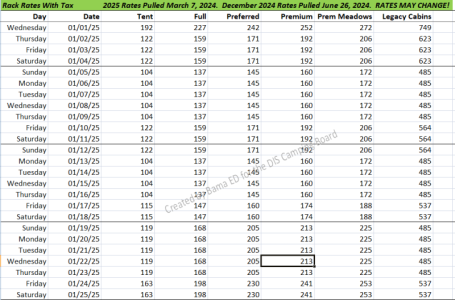
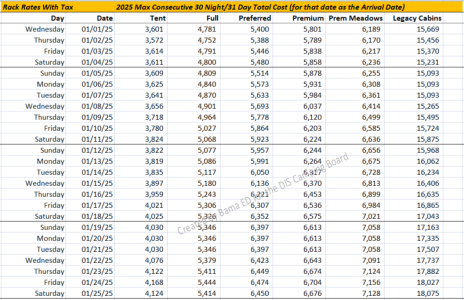
There are two PDF files attached which you should be able to download: one with single night data and one with 30 night data.
One thing that surprised me is there are some big jumps in rates in back-to-back nights when a rate period increase is implemented starting on a weekend rather than on the previous weeknight rate.
Here is an example in late September 2024 leading into the October 2024 period. Note the highlighted low Thursday night (weekday) rate compared to the next night's Friday rate (weekend) and the start of the higher Fall period.
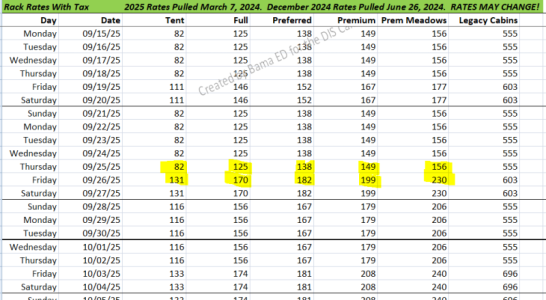
This "big jump" also happens in January 2025. It used to be that January was pretty cheap except for New Years days, the Marathon days, and the MLK weekend. Rates usually jumped to the higher rates for Spring in late January or early February. For 2025, though, the Spring rates go in starting the MLK weekend! Which really only leaves about two weeks in January with "Value" period rates. I dreamed about a 30-night stay encompassing January but that dream just got more expensive. Go see the green (per night) file around January 18-19 - it's a jump too.
Those are some whopper increases.
That's all for now. My brain is tired.
Bama Ed
PS - some internet websites recently claimed to have a year's rack rate "analysis" with just the rates shown - no analysis. But I try to show percent increases by category (this year the campsite levels were consistent within a narrow range) and also rate anomalies like the jump shown immediately above.
PPS - @team bradfield , I calc'd the 30 night table for (lucky) people like you.

After sitting on the data for a couple weeks, I've decided to go ahead and publish the rate data for 2025 at the Fort as it is right now. The reason I waited was that Disney has not released rates yet for December 2025. So I could not give 12-month 2025 info. The alternative was to give 11-month numbers or (what I ultimately decided to do was) provide 12-months of rates STARTING WITH DECEMBER 2024 and ending with the data for November 2025 (hence the asterisk * in the thread title). When December 2025 data is announced, I'll probably update to a calendar 2025 file.
A couple changes were implemented this year. I decided to list the data for EVERY NIGHT in the 12 months for all categories (campsites and legacy cabins). It actually took less time to implement than one might think. The data source is from the disneworld.com resort quote tool for the dates in the files. I also included Legacy FW Cabins (the ones being currently removed) but did not have 2023 data so there is no cabin year-over-year analysis.
All that being said .....
To set up the numbers, these were the rates on the stated dates they were pulled. Disney has and does increase rates during the season (rarely decreases) so if anything rates you find might be HIGHER than these. These rates included the 12.5% tax added to the plain rack rate and are rounded to the nearest dollar (for my sanity). Thus the rates shown represent your out-of-pocket spend.
2025 rates for all levels of campsites increased approximately 3.4-4.0% over 2024 rates. Overall the increase was 3.5% which was slightly below 2023's 3.7% and the smallest increase since the 2016 rates.
The rates with the green header at the top of the page are the daily (nightly) rates for the date shown.
The rates with the orange header at the top of the page are the 30 night totals for arrivals on the date shown.
The reason I went with showing rates per night was to be able to total up the cost of the maximum 30 night stay currently allowed. We have some DIS guests who go for long stays and I thought this would be helpful to show how much that stay might run (especially if it included various rate seasons like the January lower rates with the February higher rates). I have included a snip of each table below showing some January 2025 data.


There are two PDF files attached which you should be able to download: one with single night data and one with 30 night data.
One thing that surprised me is there are some big jumps in rates in back-to-back nights when a rate period increase is implemented starting on a weekend rather than on the previous weeknight rate.
Here is an example in late September 2024 leading into the October 2024 period. Note the highlighted low Thursday night (weekday) rate compared to the next night's Friday rate (weekend) and the start of the higher Fall period.

This "big jump" also happens in January 2025. It used to be that January was pretty cheap except for New Years days, the Marathon days, and the MLK weekend. Rates usually jumped to the higher rates for Spring in late January or early February. For 2025, though, the Spring rates go in starting the MLK weekend! Which really only leaves about two weeks in January with "Value" period rates. I dreamed about a 30-night stay encompassing January but that dream just got more expensive. Go see the green (per night) file around January 18-19 - it's a jump too.
Those are some whopper increases.

That's all for now. My brain is tired.

Bama Ed
PS - some internet websites recently claimed to have a year's rack rate "analysis" with just the rates shown - no analysis. But I try to show percent increases by category (this year the campsite levels were consistent within a narrow range) and also rate anomalies like the jump shown immediately above.
PPS - @team bradfield , I calc'd the 30 night table for (lucky) people like you.
Attachments
Last edited:
